Ever since I started this blog, I have intended discussing experimental design but so far I have ducked the issue, probably because I find sample size determination to be one of the least satisfying parts of a statistician’s job. Obviously, it is vitally important and sample size determination is certainly one of the most common requests that any statistician gets, but the traditional power analysis is so unsatisfactory that it leaves me wanting to apologise in advance.
On the plus side, experimental design forces statisticians to acknowledge the importance of prior beliefs, because they are required to ask the researcher to anticipate the data that they might observe. Unfortunately, in a power analysis these priors are usually so poorly captured that one knows in one’s heart that the solution will be unsatisfactory.
Let’s take a simple example of a trial comparing a corticosteroid cream with a placebo for patients with eczema on their hand. The measurement of response will be the patient’s rating of the severity of their eczema on a 0-10 visual analogue scale (VAS). Patients will only be randomized if their baseline VAS is over 7 and success will be defined as a VAS below 3 after one week. How many patients do we need in the trial?
We might question the use of VAS<3 as a definition of success, but let’s suppose that the researcher is wedded to it.
The statistician will have to elicit from the researcher a guess at the proportion of patients who will have a successful outcome even though they are on the placebo. Let’s say that the researcher believes that, since eczema varies naturally in severity over time, 50% of patients on the placebo will see enough improvement in a week to be categorised as successful. The researcher must then give their assessment of the proportion of successes for the new drug (say 70%) or the minimum level of success on the new drug that would be of clinical importance (say 60%).
Finally they have to specify the level of significance that they will require and the power that they want. Since researchers rarely understand these concepts correctly, they usually rely on standard practice and choose alpha=0.05 and power=0.8.
In Stata we can find the sample size using the sampsi command
. sampsi 0.5 0.6, power(0.8) alpha(0.05)
This tells us that to be confident of detecting a clinically important difference of 60% vs 50% we need 816 patients in the trial; 408 on placebo and 408 on the corticosteroid cream. This will probably shock the researcher so perhaps we might try
. sampsi 0.5 0.7, power(0.8) alpha(0.05)
Under these conditions they only require 206 patients; 103 in each group.
Researchers are usually happy with this type of calculation and it takes very little of my time, but deep down I find this to be very unsatisfactory.
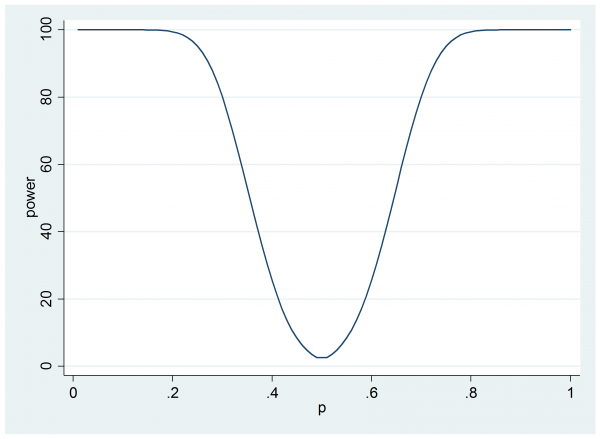
It I have the time I might encourage the researcher to look at the consequences of only having 206 patients, perhaps we might draw a simple power curve.
clear
set obs 100
gen p = .
gen power = .
forvalues i = 1/100 {
local p = `i’*0.01
qui sampsi 0.5 `p’ , n(103) alpha(0.05)
qui replace power = 100*r(power) in `i’
qui replace p = `p’ in `i’
}
line power p
Now we can see that if the cream does offer a 60% success rate then the trial will only have 25% power.
Perhaps the researcher will question why they have power to detect situations in which the corticosteroid cream does worse that the placebo when this is simply not going to happen. Are they wasting power in some sense?
Once you have started down this road it becomes hard to know where to stop.
- In this plot, we are acknowledging uncertainty in the effectiveness of the cream but what about uncertainty in the improvement under the placebo?
- The researcher ‘knows’ that the proportion of success on treatment will be greater than on placebo but how confident are they that it will be close to 0.7; if they are sure that it will be between 0.65 and 0.75, this is very different to being confident that it will be between 0.5 and 0.9, yet that is not reflected in the design.
- Is it possible that there will be no benefit due to treatment? If this possibility is excluded by their priors, is it ethical to put patients on placebo?
Everything points towards a proper elicitation of the researcher’s priors for the performance under the placebo and the treatment. It is likely that those priors will not be independent because if the researcher has misjudged the success rate under the placebo and in reality only 30% improve naturally, then the chances are that they have also exaggerated the performance of the cream and perhaps their expectation for the treatment will fall to 50% or so. If we were to spend a little time eliciting these priors then surely we could create a Bayesian sample size calculation that would be more informative.
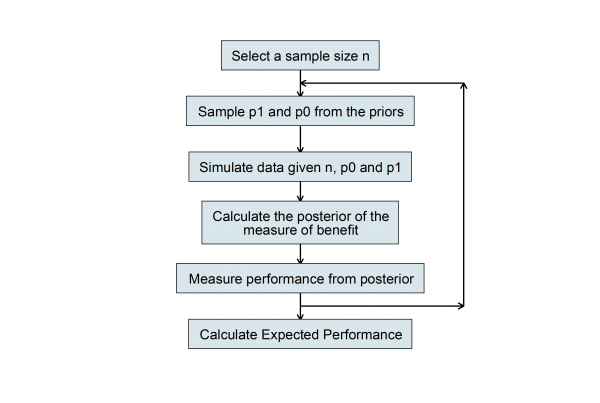
For some special cases, it is possible to solve the Bayesian sample size problem theoretically but this does not interest me. Indeed, I sometimes think that mathematical solutions hide the logic of what one is doing and make things seem more complicated than they really are. More relevant, in my opinion, is the algorithm that we use to calculate the sample size. Here is a flowchart of what we must do once we have properly elicited the researcher’s priors.
In this flowchart p0 and p1 represent the proportion successfully treated with placebo and cream respectively.
We choose a sample size n then simulate two proportions by making random draws from the priors and we use those values to simulate a random set of data. Then we perform a Bayesian analysis and calculate the posterior distribution on the chosen scale of benefit, for example, the posterior of p1-p0. From this posterior we calculate a quantity that summarises performance, such as the posterior standard deviation.
Having set up a Stata program that runs this algorithm then all we need to do is to run it lots of times with the same sample size and average the results and we will have the expected performance, in this case the expected posterior standard deviation. Try other values of n and we can see how the expected performance varies with sample size.
This is the type of solution that many Bayesians advocate and it is certainly better than the power approach but it is still slightly unsatisfactory. We have discovered that the expected value of the posterior standard deviation changes with n, but which n do we choose and why?
There is in still a step missing in the analysis.
In traditional statistics, the p-value often plays the role of the threshold for reaching a decision. Implicit in the researcher’s plans for the trial might be, if p-value<0.05 then I will recommend corticosteroid treatment for my patients, if not, then I will leave them untreated and wait for nature to take its course. Somehow we need to link the design to the decision that the researcher will make based on the results.
A second point is that when, based on sampsi, the researcher rejected the sample size of 816 in favour of one of 206, they obviously had an implicit notation of the cost of the trial in terms of money or time. There is a balance between the increased information that is available in a larger trial and the increased cost. Somehow we need to link the design to the cost of increasing the sample size.
At present, most sample size calculations ignore the decision and cost aspects of the design; in the sense that they are not made explicit. They are obviously still there, but they are hidden in the researcher’s judgement calls, such as, do I go for a power of 80% or 90%.
So it is not enough to elicit the researcher’s priors, we also need to know how they will use the results of the trial and how they view the trade-off between the gain in information from a larger trial and the cost of that trial.
Once we know these things then we can calculate a measure of the total gain or utility of the trial and we can seek the design that maximises the expected utility. In this way we will have a unique, best design.
Sure this method is complex and it requires the researcher to make explicit all of the beliefs and judgements that they usually leave unspoken, but at least a full analysis would give us the satisfaction of knowing that, given what the researcher has told us, we really have provided the best advice possible.


 Subscribe to John's posts
Recent Comments